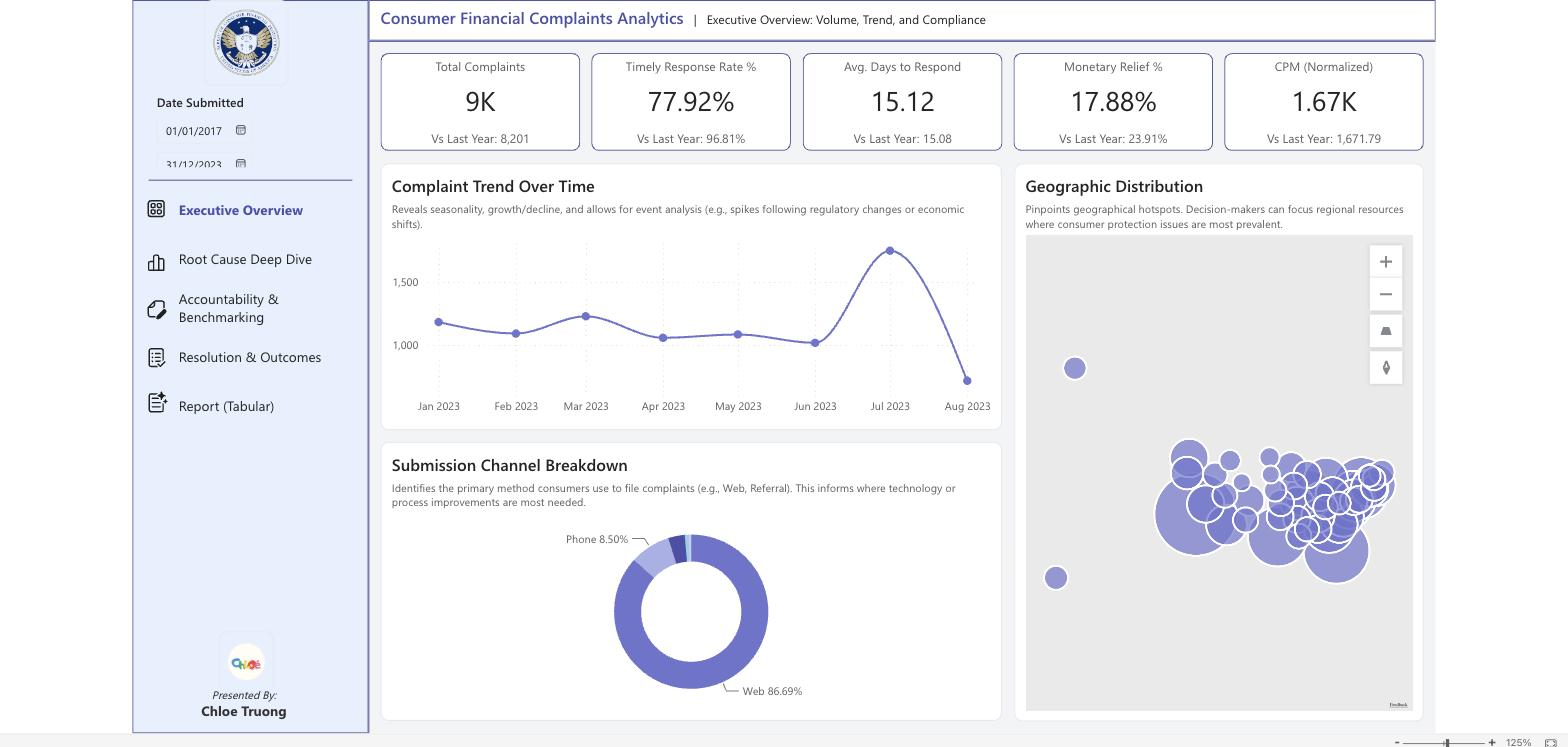
Nine thousand complaints, one root cause view
An executive Power BI dashboard over consumer financial complaint data — which products and issues drive volume, where monetary relief actually goes, and whether slower responses buy better outcomes.
I help businesses move beyond vanity metrics and build organic growth that actually compounds — through sharp strategy, clean data, and content that earns its place in search.
Each started with a question somebody couldn't answer. Open one for the full case study.
An executive Power BI dashboard over consumer financial complaint data — which products and issues drive volume, where monetary relief actually goes, and whether slower responses buy better outcomes.
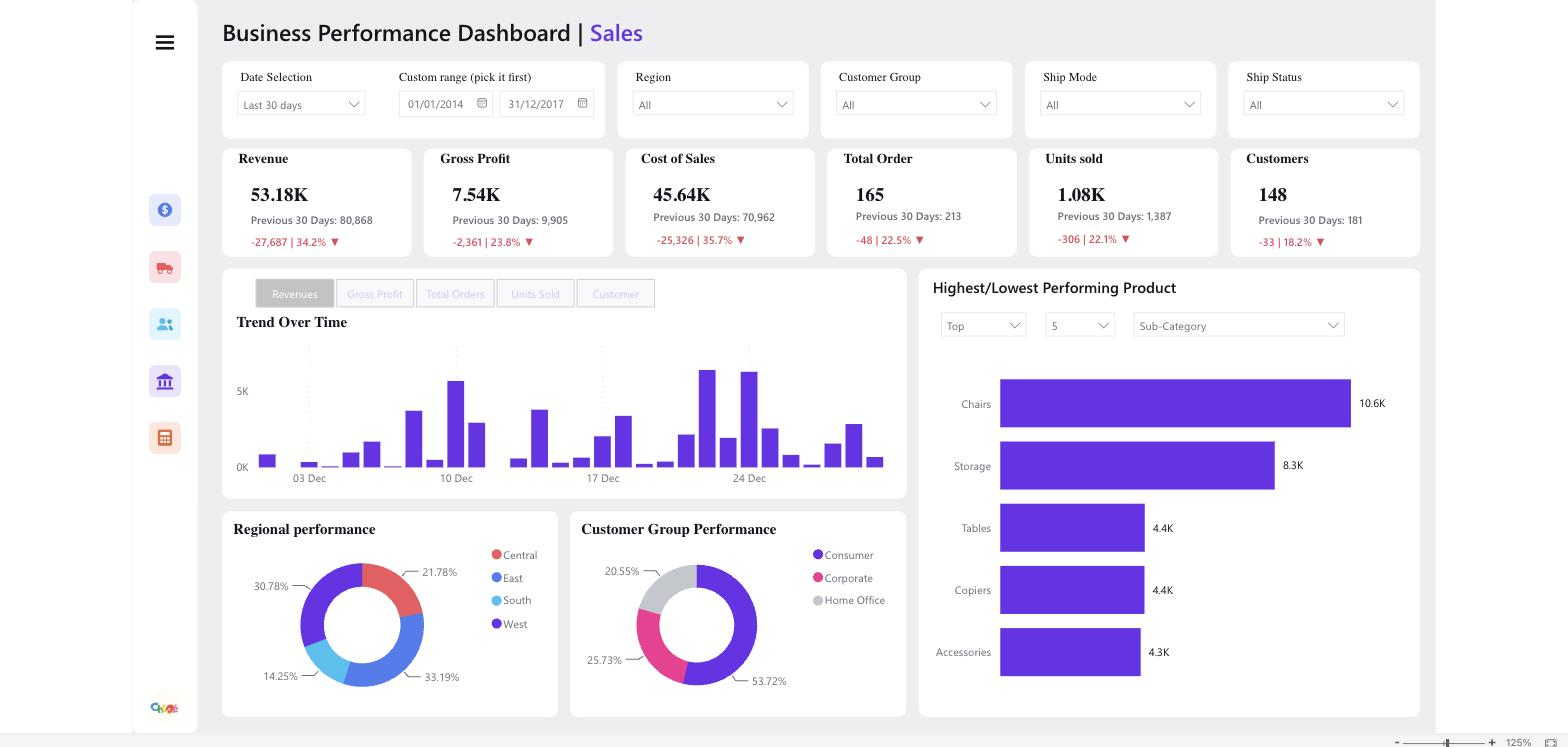
A retail performance dashboard spanning sales, supply chain, and customer behaviour — revenue grew 15% year over year, but returns nearly doubled and 46% of deliveries arrived late, erasing almost all of the gain.
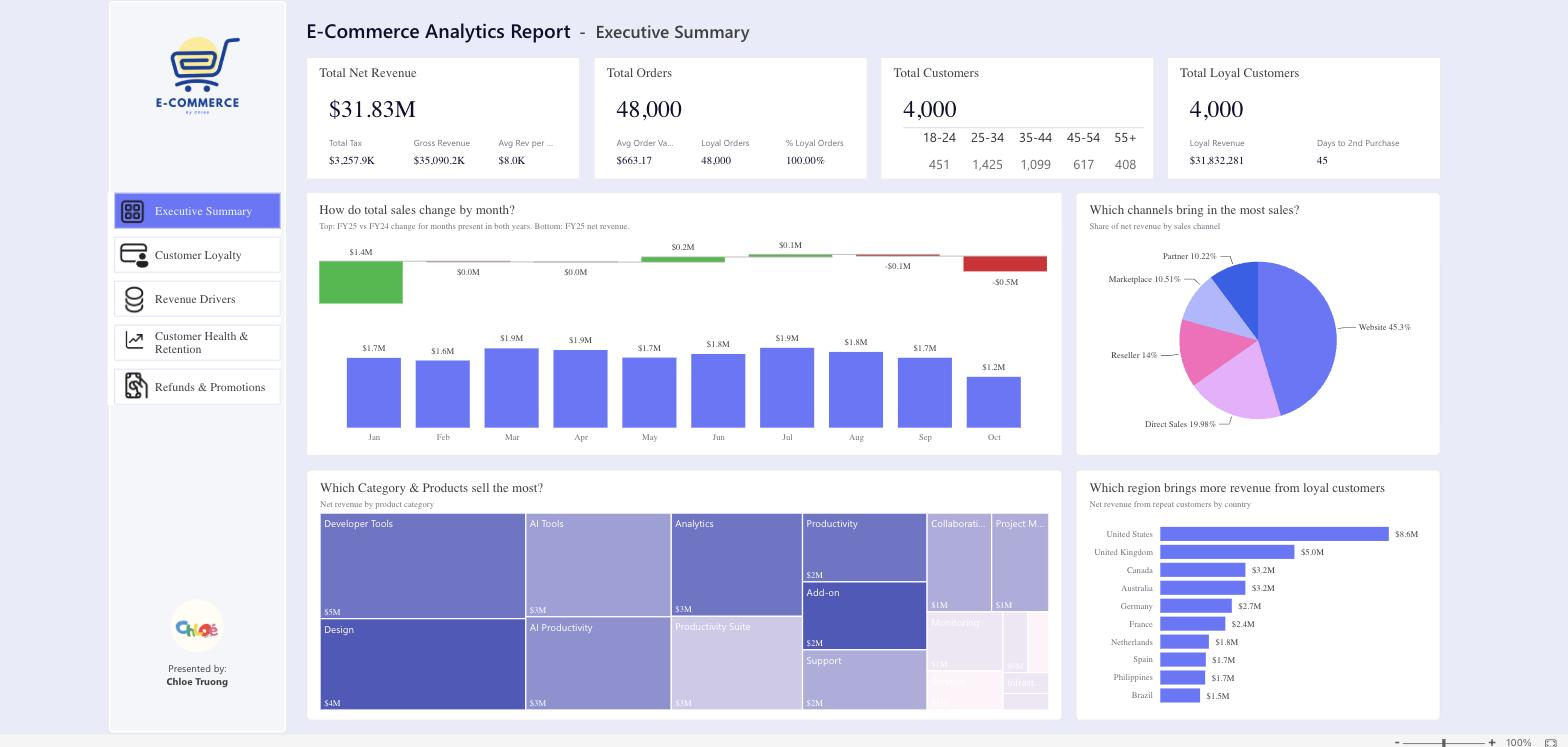
A revenue analytics platform over 48,000 transactions and 4,000 customers — which plans and deal sizes actually drive revenue, where retention is strong, and where high-value customers are churning silently.
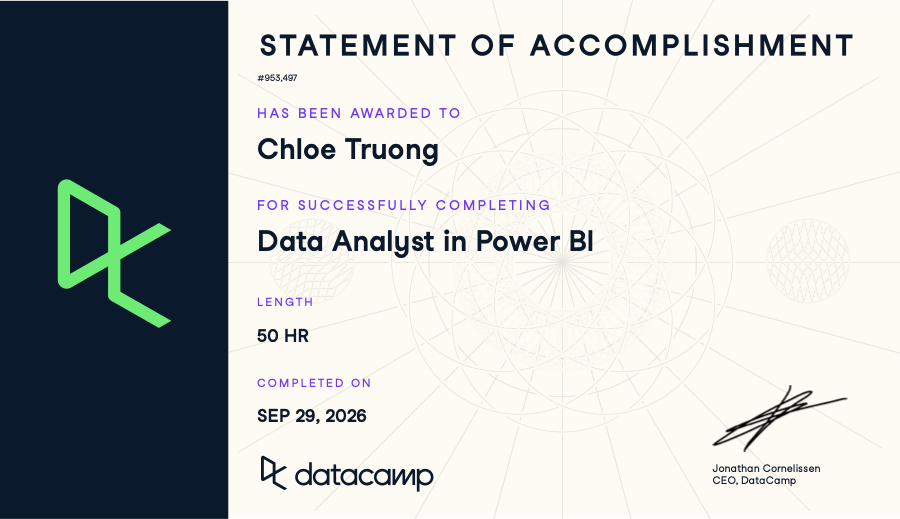
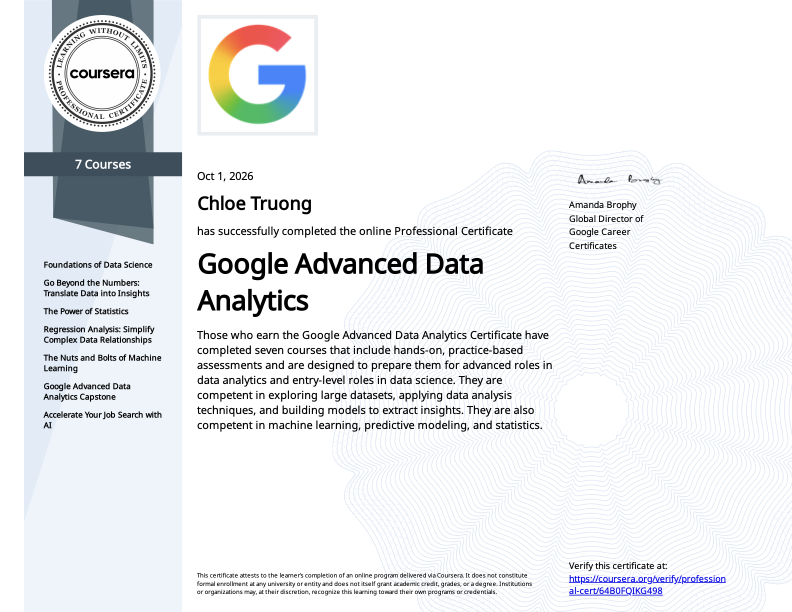
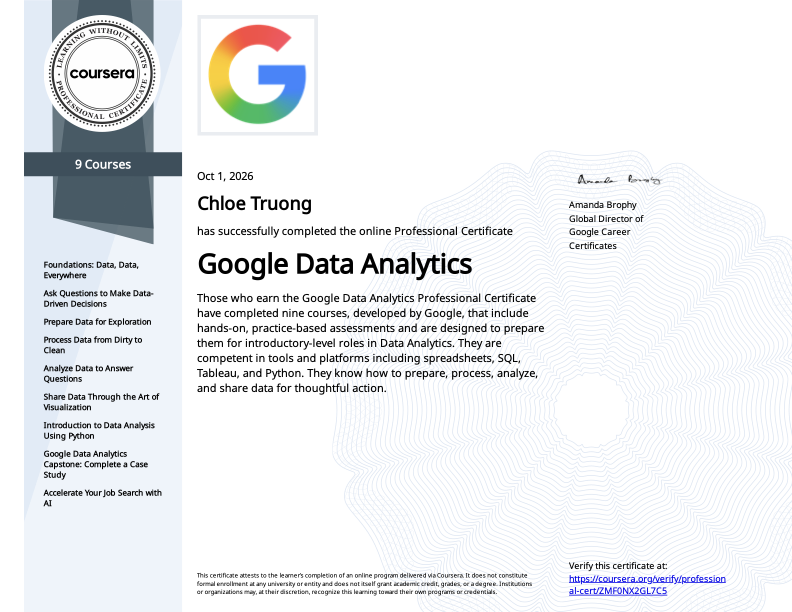
Credentials I've completed behind the tools and methods I actually use.
A curated list of tools, reading, and data sources that's shaped how I think about data analysis.
My go-to for interactive dashboards, from data modelling and DAX through to the final report.
Cleaning, exploring, and modelling data, from EDA to K-means clustering.
The foundation for querying, joining, and shaping data before it reaches a dashboard.
Quick checks, pivot tables, and ad-hoc analysis. Still the fastest way to sanity-check a dataset.
Cole Nussbaumer Knaflic's guide to cutting clutter and making every chart earn its place.
Data Vic · data.gov.au · Kaggle · Forage · GitHub
I'm available to start immediately and looking for my next data role. If you're hiring or have a data problem to work through, I'd love to chat.